|
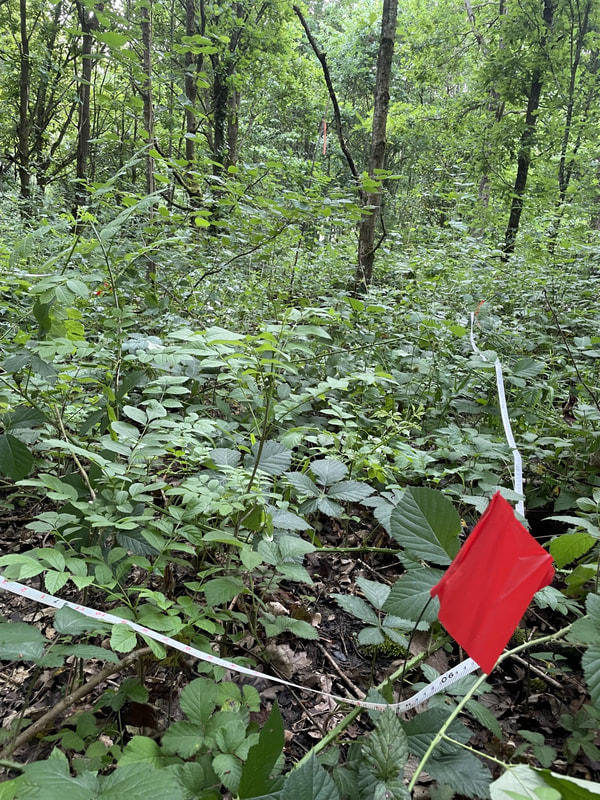
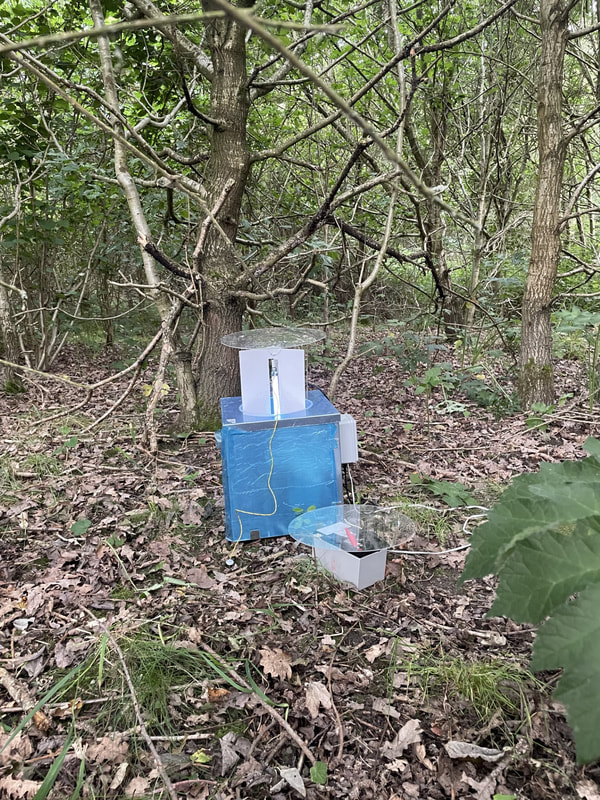
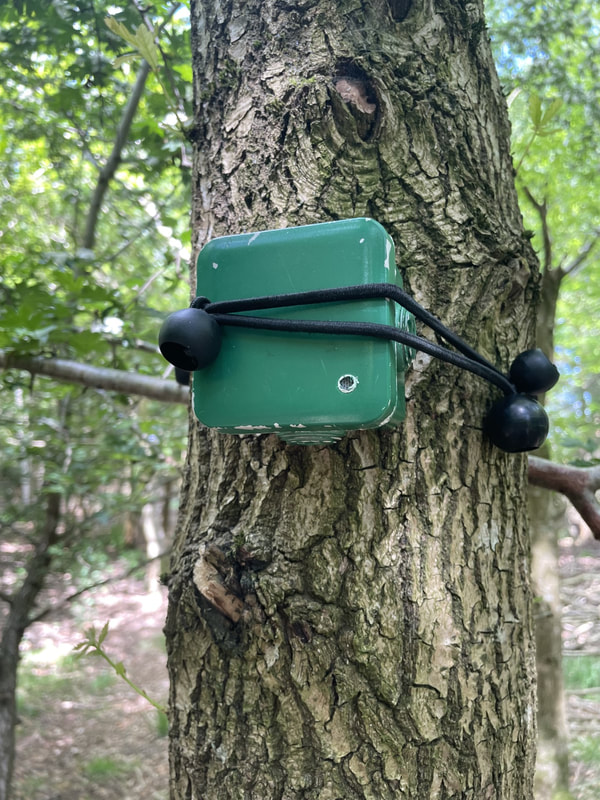
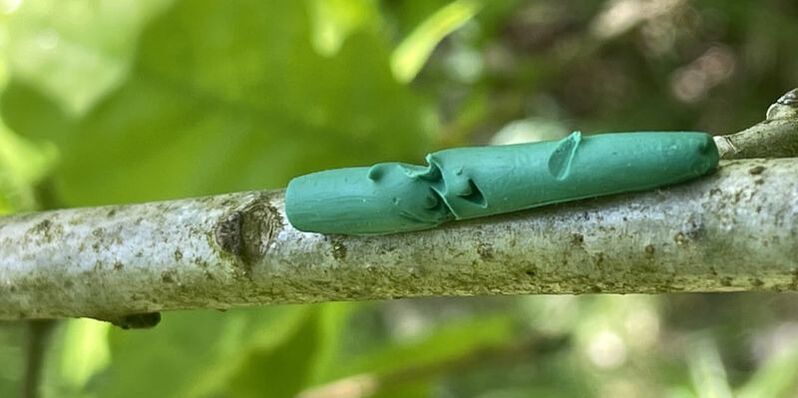
By Laura Braunholtz, University of Stirling When it comes to new areas of woodland, questions remain about the extent to which the way they are created plays a role in shaping their structure, biodiversity, and functioning. Is it always true that woodlands that are created through planting will have a more homogeneous form and structure compared to naturally colonised ones? Are trees within naturally colonised woodlands more resistant to disease than those in planted areas? Do woodlands formed through different processes provide habitat for the same species of wildlife? In trying to answer these questions and more, myself and two field researchers, Megan Layton and Billy Dykes, found ourselves crouched in a thicket of blackthorn under the blazing mid-June sun, tape measures and clipboards in hand. It was unfortunate that the random number generator had directed us to this particular location, but as we quickly learned, in young naturally colonised woodlands you’re never too far from spiky vegetation. This was during the summer of 2023, and our team of three was carrying out the ecological fieldwork for the TreE PlaNat project. We conducted a range of surveys across our study woodlands, involving multiple trips to each site between May and September. Marking the boundaries of our quadrats, while avoiding the spikes! Preparation is key Getting to the point of carrying out the surveys had taken considerable preparation. Risk assessments, protocols, purchasing equipment, and, of course, the all-important site selection process. Selecting the woodlands that made up our study locations involved months of reviewing the long list of potential sites, poring over maps and satellite images, consulting Woodland Grant Scheme datasets, comparing notes with colleagues at Forest Research, and the challenge of tracking down landowners and managers to gain permission to carry out our surveys. The resulting list of 28 sites was spread across central and southern England. We kept a number of properties consistent across our sites; they were all relatively young woodlands, ranging from 15-30 years old, adjacent to areas of established woodland and on land that had previously been arable or improved grassland. Seven of our woodlands had been planted, nine were sites of natural colonisation, and twelve came under our “mixed” category, having a combination of planting and natural colonisation processes at play. Into the wilderness we go Now we were carrying out our surveys, collecting data on several metrics that we had chosen to represent the structure, ecological function and biodiversity of woodlands. This included setting out five 20m diameter plots at each site, within which we were identifying trees, measuring their diameter at breast height (DBH) and counting seedlings and saplings to assess tree biomass and habitat complexity. We also assessed the trees for signs of disease or pests, focusing on those of highest concern (further information: Observatree). We checked a sample of leaves from ten trees in each plot for signs of damage by insect herbivores and recorded the number of seedlings and saplings that had been browsed by mammal herbivores. Using 20 plasticine caterpillars at each site, we quantified predation pressure on insect herbivores. To quantify the biodiversity value, we were assessing several different taxonomic groups. In small quadrats, we looked at herbaceous vegetation, poring over keys and guidebooks to identify species of grass, ferns and other flowering plants. We set out camera traps to document sightings of mammal species and placed acoustic recorders in trees to capture the sounds of passing insects, birds and bats. On two different nights during the summer months, two moth traps were set up at each site and Billy had some very early morning starts to check the traps, identify the species within, and release all moths on site. For the final surveys in August, Dr Thiago Silva flew a drone mounted with a LiDAR sensor over all the sites to capture information about the structure of the woodlands. A selection of TreE PlaNat surveys: Heath light trap for moths, AudioMoth acoustic recorder, and plasticine caterpillar with evidence of bird pecks Data, data, data
Reflecting on the field season now, summer seems a distant past, and November’s short, cold days see me sitting at my laptop writing code to crunch the numbers and try to answer our research questions. We collected an impressive amount of data, measuring over 5000 trees from 36 different species, as well as counting over 1000 seedlings and saplings from 24 tree species. We captured nearly 2500 moths from 398 species and identified over 130 species of herbaceous ground flora. The camera trap and AudioMoth data files are still being processed; soon, we’ll know more about the mammals and bird species using our woodland sites. Data analysis might not sound as glamorous as frolicking among the trees, but it's the key to understanding the intricate ecological dynamics at play within these ecosystems. Spoiler alert: nature's spreadsheet is a lot messier than Excel. Check back soon to find out what we’ve learned!
0 Comments
Your comment will be posted after it is approved.
Leave a Reply. |
AuthorsLaura Braunholtz, Ecology post-doc, University of Stirling Categories
All
|


 RSS Feed